Savonia Article:
Performance Optimization and Condition Management of Industrial Pumping System using Real-time Data Analytics
#SavoniaUAS
Optimizing the performance of the industrial pumping system is in increasing demand nowadays. The purpose of optimization is to save resources and energy consumption, enhance productivity and extend the life cycle of the pumping devices. For these reasons, a variety of IOT technologies can be applied in this field to continuously monitor and optimize the performance of pumps. With the support of the Savonia University Applied Sciences and Viimatech equipment, we implement a smart water project in the Savonia water laboratory (WaterLAB). The project uses the VT03 pumping monitor to record the activities of the pumps and analyze the data. The result showed the potential ability to combine greater efficiencies with sensors and software to regulate and control flow and pressure. Two small abnormalities were detected and classified. The data collected from the sensor helped to understand the current condition of the pump as well as the events that had happened to the system in the past. Then it could improve the result of the maintenance process.
Introduction
The Industrial Internet of Things (IIoT) revolutionary technologies have transformed the industrial product in many aspects. One of the fields that can be benefited from the advance of IIOT technology is the pumping industry. In the past, conventional pumping systems need to be checked up and maintained manually, which leads to discontinuity in pumping monitors and sometimes it leads to delays in error detection and correction. IIOT technology can offer solutions for continuously checking up on the pumps and pipeline condition by using a sensors system and computer power. Hence, any trouble with the systems as well as abnormal performances can be detected early and system failures can be avoided. Application of IIOT in industrial pumping systems hence reduces overall maintenance costs and life-cycle costs. The device used in this project is VT03 equipment from Viimatech company (https://viimatechdigital.com/). The main objective of this work is to collect the data on pumping performance, analyze data to detect any abnormalities and suggest a solution for continuous improvement activities to achieve the pump’s best efficiency condition.
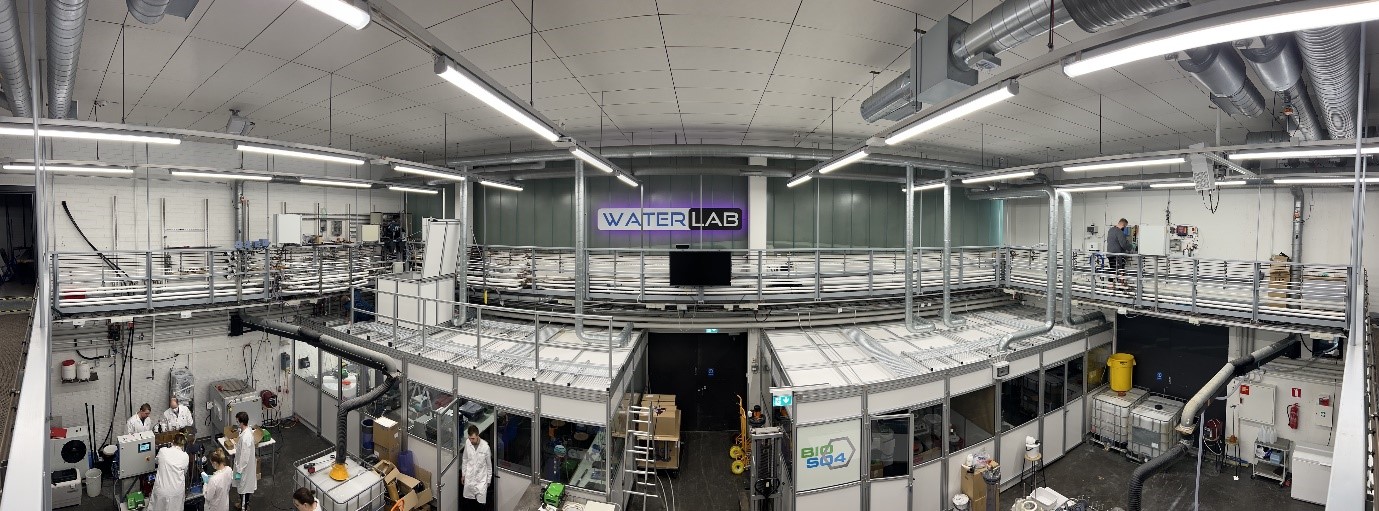
Savonia Water Lab
Savonia provides a specialized water laboratory, named WaterLAB, that is equipped with WaterLOOP. WaterLOOP is a Distribution System Simulator (DSS) that runs continuously 24/7 throughout the year. WaterLOOP is a water pilot facility that consists of nearly 1 km of pipework in a looped-branched network. It has a water intake, first and second-stage pumping stations, and a dual wastewater system with a separator tank located beneath the WaterLAB. The separator tank eliminates impurities that cannot be directly discharged into the municipal wastewater system. WaterLOOP can operate in both closed and open loop modes. WaterLAB generally uses Kuopio water in circulation, but we have a containerized water treatment plant that can generate potable water from any source.
WaterLOOP is equipped with a wide range of specialized online sensors that continually and in the real-time record a comprehensive water chemistry fingerprint. If needed, we can use conventional grab sampling and examine against our laboratory-grade instruments. As the entire piping system is exposed, there are few restrictions on adding extra measurements or sensors. These can be provisionally installed according to the research needs and purposes.
WaterLOOP’s distribution system simulator is suitable for a broad range of applications, including recreating critical operational scenarios of the water distribution system or simulating intentional or unintentional contamination events caused by changes in water treatment processes, network pipe system interventions, flushing, pipe damages, cross-contamination, or intentional attacks on the water source.
In this completely sandboxed environment, we have control over all parameters, with a limited number of unknowns. The operator can induce physicochemical, and microbiological contaminations, hydraulic disturbances, and leakage events in a fully replicable manner. This includes sudden, mid- or long-term changes in water quality parameters, testing of single or multiparameter changes, and custom matrices of parameters affecting water quality.
Operator can carry out precise experimental plans and introduce random changes in water quality. WaterLOOP combines online monitoring with real-time modeling to develop tools such as Decision Support Systems, network awareness and detection of abnormal system operation, testing of new devices or services, and water quality studies. Since all experiments contain metadata that accurately describe the system conditions, WaterLOOP can prepare training and validation data sets for artificial intelligence applications.
In addition, Savonia provides access to WaterLAB, a facility staffed by experts, trained technical personnel, specialized equipment, and resources that are available as a service. Savonia can provide all of the necessary components that startups or SMEs require, particularly for deep technology development. After the development stage, it is essential to test and demonstrate the first prototypes in a real-world system. To facilitate this process, Savonia offers the SuperDMA full-scale demonstrator, which is part of the water distribution system operated by the local water authority and located in the WaterLAB vicinity.
The SuperDMA demonstrator is a full-scale facility within the Savilahti Innovation Ecosystem, a highly dynamic and fast-growing area of Kuopio. This ecosystem is a downsized replica of the future Smart Kuopio City and serves as a model for a small city, making the demonstrations both relevant and scalable. The underground infrastructure, including the water network, is completely covered, and the water system is outfitted with specialized chambers that allow equipment to be installed on bypasses without disrupting normal operations.
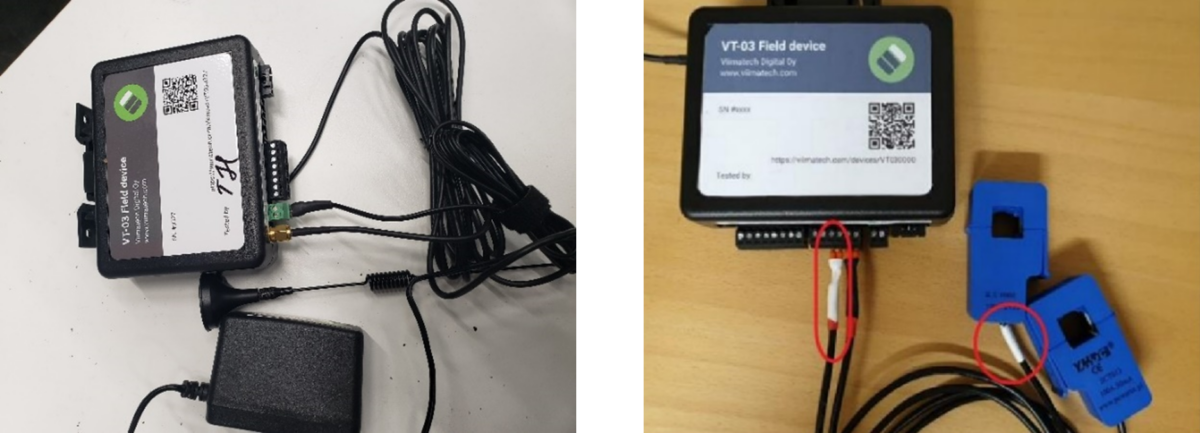
Viimatech VT03 Pumping Sensor
The VT03 device uses a non-invasive sensor (also known as a split core current transformer) to measure the current and power of the pumps. Two probes are clamped around the power source of the pumps. When the current goes through the power line of the pump system, it will create a magnetic field around a current-carrying conductor, the sensors now work as inductors that are able to capture the change of the current. The induction current appearing in the coils of the sensor is used to calculate the intensity of the current in the power line. Two main parameters monitored by the sensors are the current phases and the current loop. From these parameters, four indexes are obtained to evaluate the condition of the pumping system: running cycle length, runtime average phase current, the time between cycles, and motor duty cycles. The VT03 pumping monitor device is shown in Figure 1.
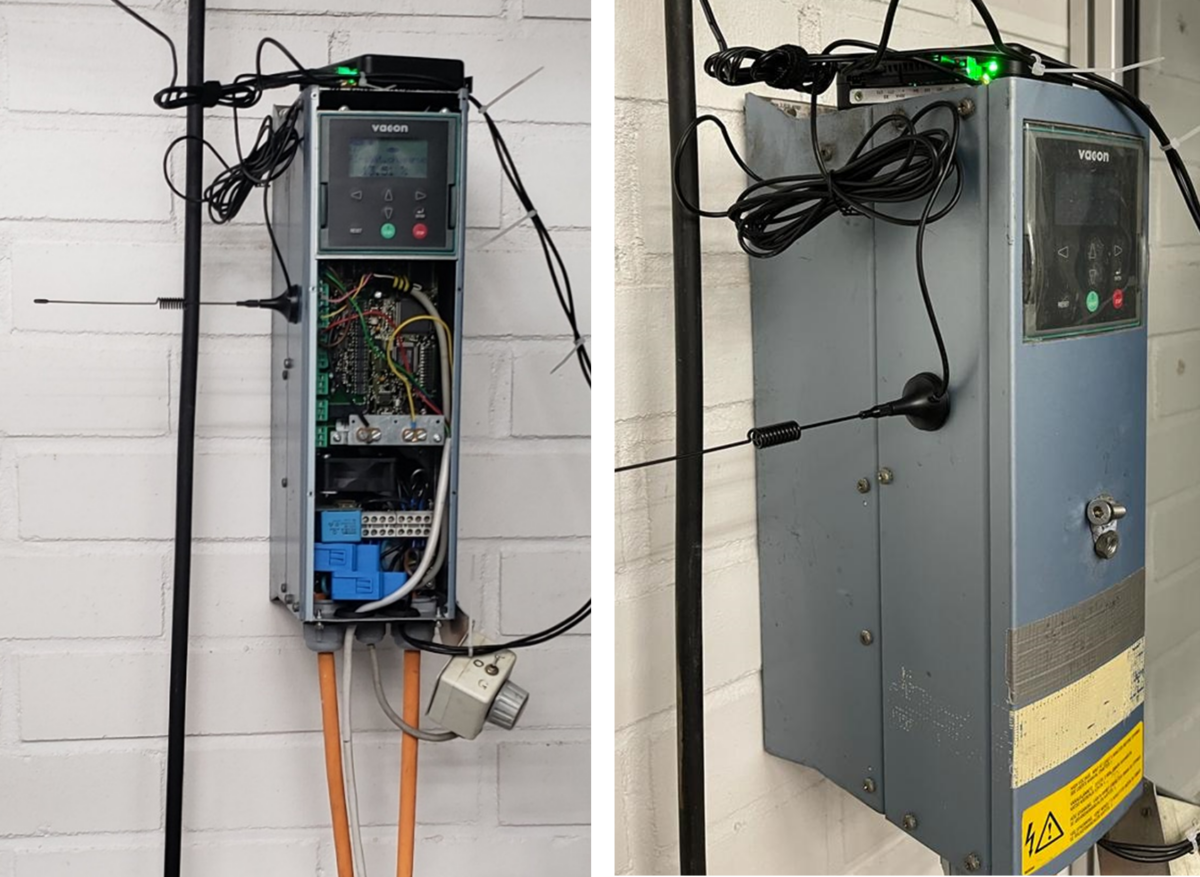
Devices Implementation
The sensor VT03 devices are installed on the main pumping in the Savonia UAS water laboratory. Two probes are respectively wrapped around the hot wire and neutral wire of the pump power wire. There are 5 main steps to setting up the sensor system:
– Step 1: Connect the 24VDC power input to the terminal X3 POW.
– Step 2: Attach the current transformers to the motor phase conductors.
– Step 3: Connect the other inputs to their correct terminals.
– Step 4: Attach VT03 to DIN rail
– Step 5: Connect the power cable. When VT03 boots for the first time, the indicator LED will blink to show the status of the device. The Red led will turn on 10s after the power cable is connected. Blue led indicates the connection start opening, but no data is transmitted yet. When the green led turn on then the device is fully operated.
The installation failure can be detected from the Led indicator. If the device does not send data after 10 minutes, reboot the device by disconnecting the power, waiting 30 seconds, and connecting the power back.
The data is collected by this sensor and results are sent to the cloud by a small antenna. The company provides a web-based user interface with visualization graphs and data storage services. Hence the users are able to access the history data of the pump performance. Any abnormal activities can be easily seen on the user interface.
Results
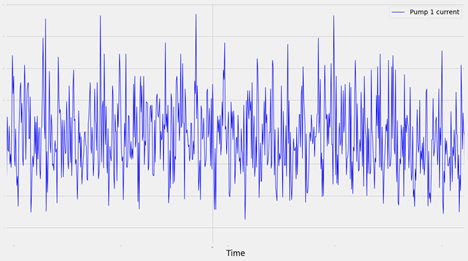
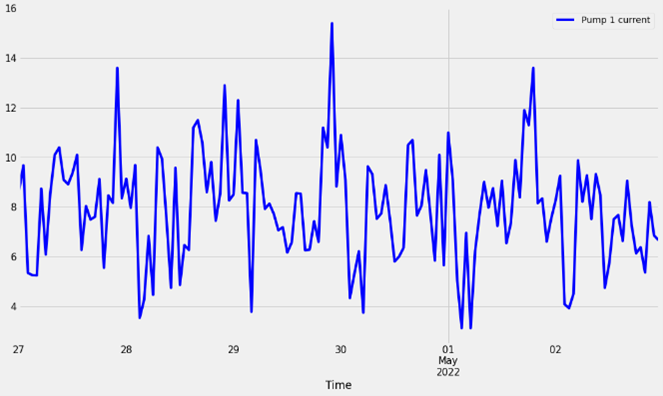
The performance of the VT03027 is observed in 4 weeks. The sensor is installed to take measurement samples one time each hour. The current draw from normal operation of the pumping system is 7.6 measurement units on average. If the amount of current used increases dramatically, the pump is probably jammed. If the current consumption is higher than the average for a long duration, it properly indicates that the pump needs to lubricate, and a check-up maintains the bearing bush and ball bearing to reduce friction. On the other side, a sudden quick drop in current implies a blockage in the suction line or pin shear. The data from the sensor can help to detect this abnormality within milliseconds of the occurrence. Hence the system can be shut down early to avoid severe damage to the motor or pump because of overheating. The data collected in four weeks is presented in the graph below shown in Figure 3.
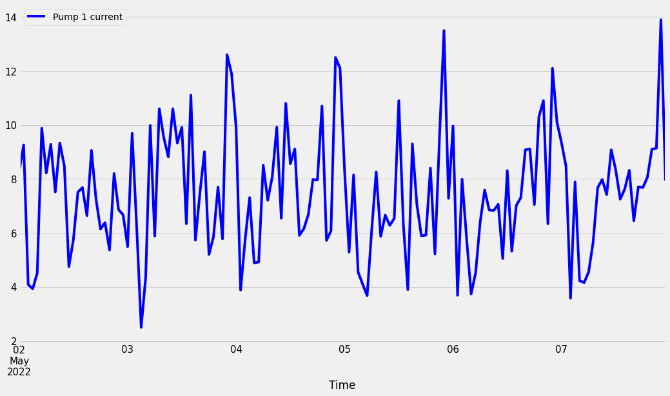
We create a python program to visualize the data in python. The user can enter the period of operation to create a graph of energy consumption in this duration. The graph shown in Figure 4 demonstrates the analyzing result in a period of 7 days:
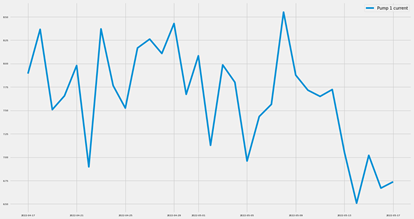
Energy consumption by the hour is created to analyze the peak and trend of pumper performance on average. The pumper is least active in the morning from 3 AM – 7 AM and most active in the evening from 21 PM – 23 PM. From 6 AM – 18 PM, the pumper usually runs constantly and steadily. All the data point is grouped by day and then average consumption is calculated for each day. From the average performance graph shown in Figure 5, the user can compare these values to detect any abnormal event that happened in the observed period. In detail, there were four points that the sensor recorded the abnormal high measurement, they are 20/04, 23/04, 30/04, 0and 9/05. The measurement was high as 15, approximately 16.
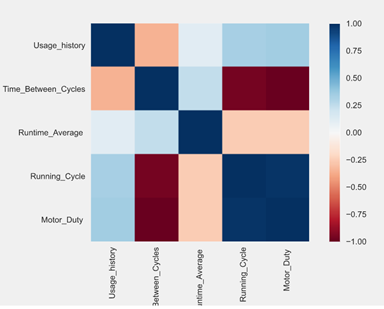
In order to inspect the relationship between the daily usage history with other variances provided by Viimatech, we used Correlation Matrix. A correlation matrix, shown in Figure 6, is simply a table that displays the correlation coefficients for different variables, and correlation coefficients are indicators of the strength of the linear relationship between two different variables. If the correlation coefficients are greater than 0.7 or smaller than -0.7, then it can be concluded that there is a relationship between the two properties. Their result showed a weak relationship between these properties with daily usage, in the range of 0.2 to 0.3. Therefore, there is no linear relationship between them, or the usage is independent of other properties.
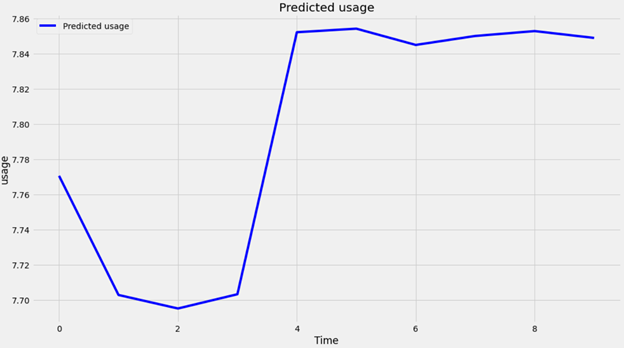
A long short-term memory (LSTM) neural network is used to predict the usage of the pumper in the next hour. The training data set includes 720 values in 30 days, provided by Viimatech. After training, the model will take an input array of usage in 10 hours and predict the usage for the next 10 hours.
Discussion and Conclusion
The application of the VT03 device on the water pumping system provides valuable data about the condition of the pumps. The data indicates that the pumping system operated steadily during the observation period. Data collected from the pump can be used in combination with a machine learning tool to reach the Best Efficiency Point. It also provides a fundamental base to build a digital twin version of the pumper system in the future. The MQTT protocol can be applied to improve the performance of the sensor system.
Acknowledgments:
We acknowledge the support of WaterLAB’s research manager, engineers, and Viimatech for providing devices for testing
Authors and Affiliation:
Dung N Lai, IoT student, Savonia University of Applied Sciences
Sameer Karn, IoT student, Savonia University of Applied Sciences
Patryk Wójtowicz, Research Manager, Savonia University of Applied Sciences
Rajeev Kanth, Senior Lecturer, Savonia University of Applied Sciences