Savonia Article Pro: Analysis and Prediction of Electricity Consumption (ÄLLITÄ Project)
Savonia Article Pro is a collection of multidisciplinary Savonia expertise on various topics.
This work is licensed under CC BY-SA 4.0![]()
![]()
![]()
This article is a continuation of first article ÄLLITÄ project. The focus of this article will be on WP2 (data and artificial intelligence in smart energy solutions), and further data analysis will be discussed for electricity consumption data alongside weather data and prediction of electricity consumption with base model (linear regression model).
Weather data for Varkaus was obtained from Ilmatieteen laitos weather station which is located 1 kilometer away from the pilot’s site, Savonia’s campus at Varkaus. The range of this data is from January 01, 2023 – April 30, 2024, and this data is in 1 hour interval. Previously, the electricity consumption data was also in 1 hour interval and for same period of 16 months. Weather data contains features of ‘Air temperature mean [°C]’, ‘Dew-point temperature mean [°C]’, ‘Cloud cover [1/8] (0 = clear skies, 8 = overcast, 9 = cloud coverage could not be determined)’, ‘Air pressure mean [hPa]’, ‘Relative humidity mean [%]’, ‘Precipitation amount mean [mm]’, ‘Snow depth mean [cm]’, ‘Horizontal visibility mean [m]’, ‘Wind direction mean [°]’, ‘Gust speed mean [m/s]’, ‘Wind speed mean [m/s]’.
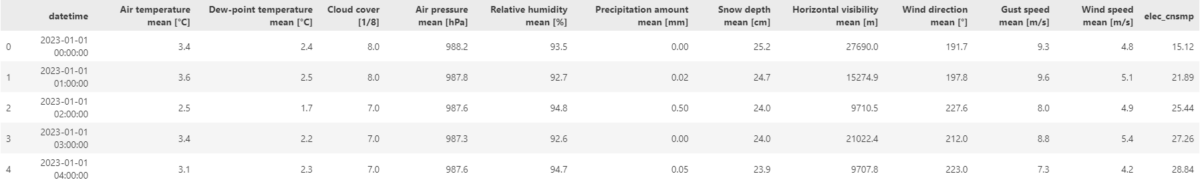
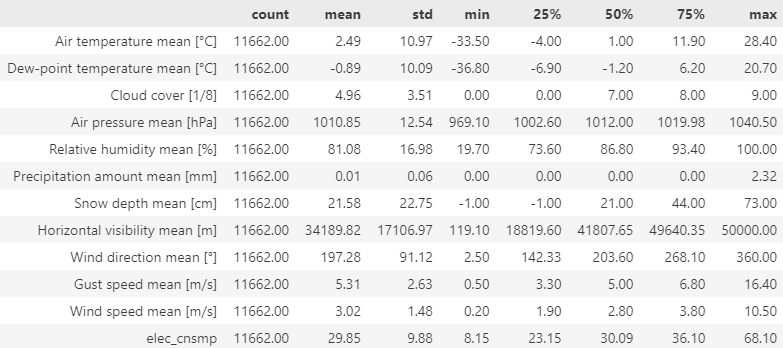
There were some missing and null values in weather data, and they were processed before combining with electricity consumption data. These two datasets are then combined to analyze the effect of weather variables on electricity consumption of pilot site. There are 11662 records of the data, and the first 5 records are shown in Figure 1. Firstly, descriptive statistics for the whole dataset are performed and displayed in Figure 2.
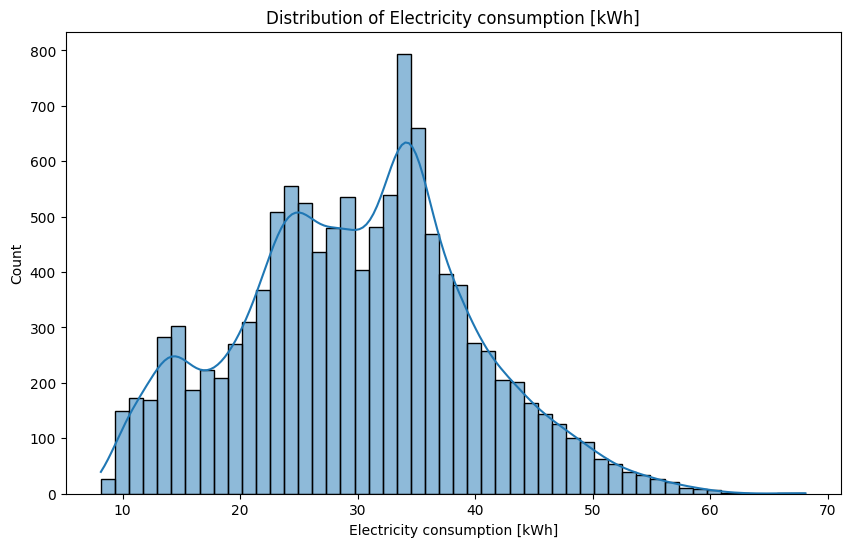
Then, distribution of electricity consumption is calculated using the histogram with 50 bins and smooth distribution line which shows that electricity consumption is between 20 to 45 kWh in most cases as seen in Figure 3 below. Figure 3 also shows that data does not have fully normal distribution. The skewness value of electricity consumption data is 0.11, which shows that data is skewed a bit right and has longer right tail. The kurtosis value is -0.27, which shows that data has a light tail (not dense).
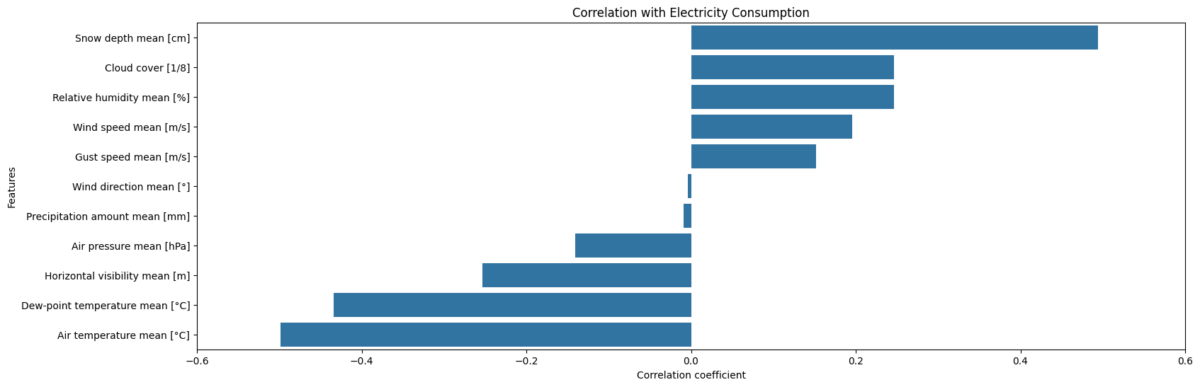
Next step for data analysis is to find the effect of weather features on electricity consumption. Pearson correlation is performed to find the effect of weather features and is shown in Figure 4. It shows that snow depth has positive correlation while air temperature and dew-point temperature show negative correlation with electricity consumption. Correlation of other features is not significant with electricity consumption.
Prediction of electricity consumption
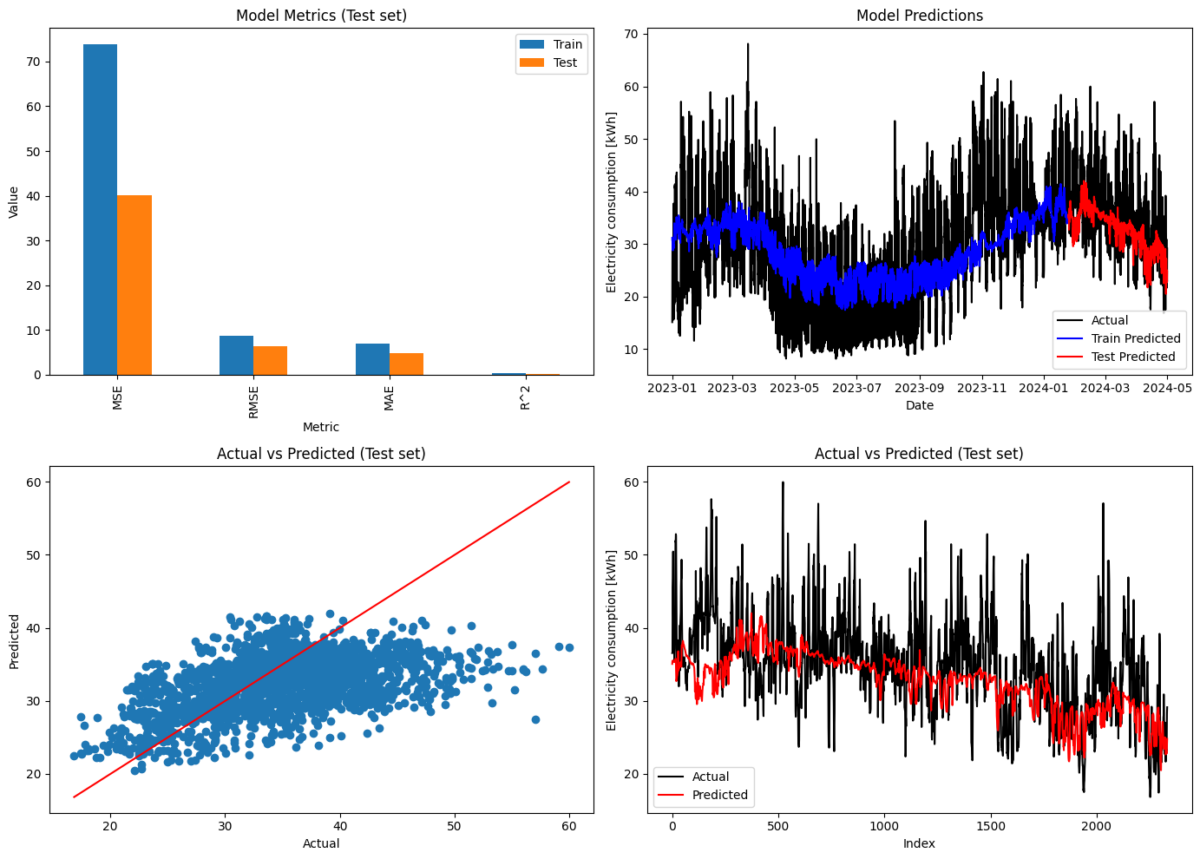
Prediction of electricity consumption with weather features using Linear Regression (LR) algorithm is performed as a base model. Of all weather variables, ‘Air temperature mean [°C]’, ‘Dew-point temperature mean [°C]’, ‘Cloud cover [1/8]’, ‘Snow depth mean [cm]’, ‘Relative humidity mean [%]’ were selected based on the correlation coefficient. A feature matrix, containing previously mentioned features, is created along with a target vector for electricity consumption. Then data is split into training (80%) and testing (20%). The Linear Regression model is trained using training data and tested with unseen test data. Four metrics (mean absolute error 4.85, mean squared error 40.09, root mean squared error 6.33, and r2 0.10) for test data are being used for model evaluation. Performance of LR model is shown in Figure 5.
This is the base model for this task, and we will discuss about time features, lag features, feature engineering, and more robust AI models in the upcoming articles.
Authors:
Shahbaz Baig, RDI Specialist, DigiCenter, Savonia-ammattikorkeakoulu, shahbaz.baig@savonia.fi
Premton Canamusa, RDI Specialist, DigiCenter, Savonia-ammattikorkeakoulu, premton.canamusa@savonia.fi
Mika Leskinen, RDI Specialist, DigiCenter, Savonia-ammattikorkeakoulu, mika.leskinen@savonia.fi
Aki Happonen, Digikehityspäällikkö, DigiCenter, Savonia-ammattikorkeakoulu, aki.happonen@savonia.fi
Laura Leppänen, RDI Specialist, Savonia-ammattikorkeakoulu Oy, laura.leppanen@savonia.fi