Savonia Article Pro: Analyses of solar photovoltaic (PV) power production data (ÄLLITÄ project)
Savonia Article Pro is a collection of multidisciplinary Savonia expertise on various topics.
This work is licensed under CC BY-SA 4.0
Renewable energy sources such as PV energy production have zero carbon emissions. Its demand is increasing day by day and households are installing PV systems to mitigate energy crisis and carbon emission. In Finland, the aims of the Just Transition Fund are to halve the use of peat by 2030. Finland’s climate neutrality goal is to increase the share of renewable energy sources to 51% by 2035. These goals can be supported with the use of solar PV energy as one of the possible renewable energy sources.
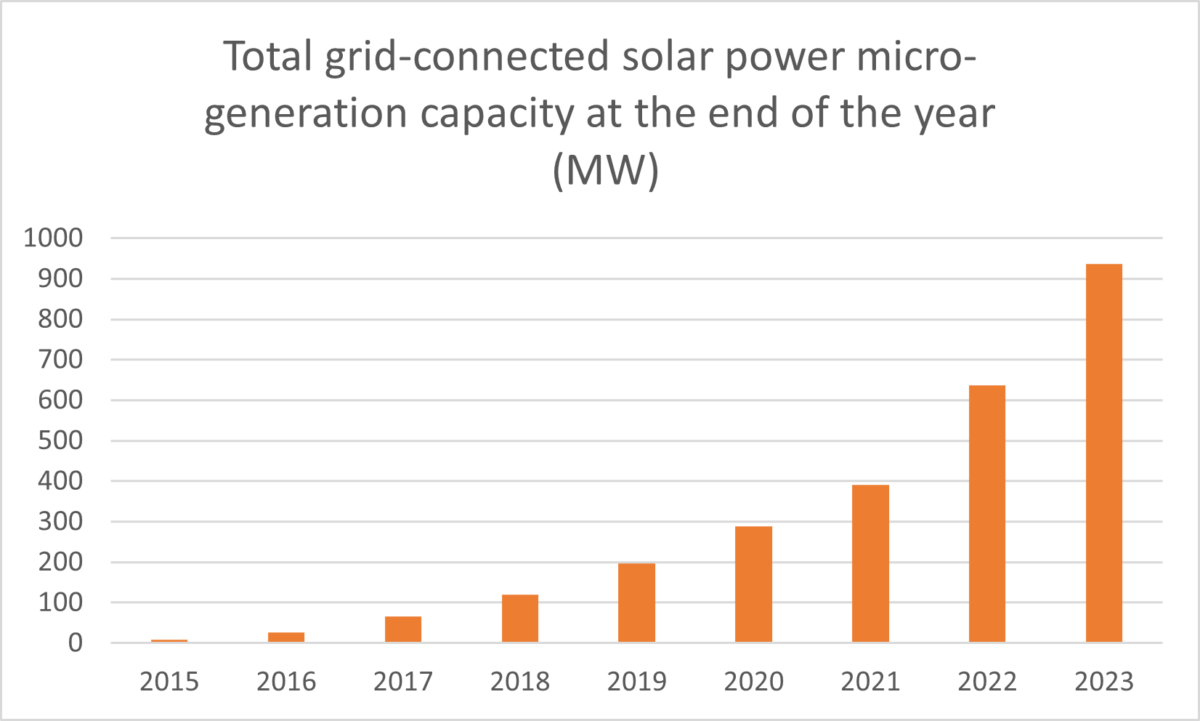
Solar PV production capacity in Finland increased to approximately 1,000 megawatts (MW) at the end of 2023. Micro-generation refers to the PV production less than 1 MW and it was 936 MW during 2023 which is nearly 300 MW (47%) more than the previous year. 50 MW was produced by industrial PV plants (PV energy capacity > 1 MW) while 23 MW was installed at recreational places. Finland’s total grid-connected power capacity was almost 23K MW and solar PV accounted for approximately 4% of it. There is a possibility to increase the production of PV energy by installing large-scale PV plants and household PV systems. Figure 1 shows the increase of grid-connected PV systems [1].

Pilot for ÄLLITÄ project
There is a PV system of 2 KW peak capacity installed at Savonia University of Applied Sciences, Kuopio campus. We have PV data from April 18, 2024, to September 15, 2024, with 1 hour interval. Figure 2 shows the PV production during this period.

Maximum PV production was 1472 Wh (1.47 kWh) during this period and there was significant difference between the PV production during the day (6:00 – 21:00) and night (22:00 – 5:00) which is shown in Figure 3 below. Values for the day are on the left y-axis while the value for the night is on the right y-axis.

When looked at from a monthly timescale, the data presents an interesting pattern with May being the month with the highest production. As seen in the boxplot in Figure 4, the month of May has not only the highest maximum production, but also the highest average production. This pattern can be understood at a deeper level, once this data is analyzed in context with the weather parameters during the same time period.

We resampled PV production data to daily level to analyze its performance. The minimum PV production for 1 day was 111 Wh (0.11 kWh), maximum PV production was 9190 Wh (9.19 kWh ), while average PV production for 1 day during this period was 4910 Wh (4.91 kWh). Daily PV production data is shown in Figure 5 below.

Peak PV production was during the middle hours of the day i.e., between 11:00-15:00 and this can be seen from Figure 6 below. The graph also shows a sharp increase in PV production between 9 AM and 10 AM and a notable decrease in the evening between 4 PM and 5 PM.

We will analyze the effect of weather variables in the next article along with the PV data of Varkaus campus and will present some of the AI models to predict PV production effectively.
References:
1. Energiavirasto, https://energiavirasto.fi/en/-/solar-power-production-capacity-rose-to-1-000-megawatts , assessed on Dec 09, 2024.

Authors:
Shahbaz Baig, RDI Specialist, DigiCenter, Savonia University of Applied Sciences, shahbaz.baig@savonia.fi
Premton Canamusa, RDI Specialist, DigiCenter, Savonia University of Applied Sciences, premton.canamusa@savonia.fi
Mika Leskinen, RDI Specialist, DigiCenter, Savonia University of Applied Sciences, mika.leskinen@savonia.fi
Aki Happonen, Digital Development Manager, DigiCenter, Savonia University of Applied Sciences, aki.happonen@savonia.fi
Laura Leppänen, RDI Specialist, Project Manager, Savonia University of Applied Sciences, laura.leppanen@savonia.fi